AI Platform Redesign Modernizing Infrastructure Management Software
AI Platform Redesign Modernizing Infrastructure Management Software

Cyvl helps governments build and maintain great roads. Their roadway mapping sensors and cloud-based geospatial algorithms help communities maximize their roadway and transportation budgets.
Team & Role
Product Team: Engineer, Product Head, CEO
My Role: Lead UX Designer
Duration: 15 days
Responsibilities: User research, UX/UI design, usability testing, prototype development
Problem
Infrastructure maintenance teams face two critical challenges:
Industry Challenge: Traditional infrastructure inspection methods are manual, time-consuming, and potentially dangerous for workers.
Platform Challenge: The current Cyvl platform has poor usability with confusing navigation, inconsistent branding, and a complex site structure that makes it difficult for users to complete their tasks efficiently.
Objectives
Create an intuitive, streamlined user experience with simplified navigation
Implement a modern design that aligns with brand identity
Develop new features based on user personas to better support infrastructure maintenance workflows

Old Platform
Cyvl helps governments build and maintain great roads. Their roadway mapping sensors and cloud-based geospatial algorithms help communities maximize their roadway and transportation budgets.
Team & Role
Product Team: Engineer, Product Head, CEO
My Role: Lead UX Designer
Duration: 15 days
Responsibilities: User research, UX/UI design, usability testing, prototype development
Problem
Infrastructure maintenance teams face two critical challenges:
Industry Challenge: Traditional infrastructure inspection methods are manual, time-consuming, and potentially dangerous for workers.
Platform Challenge: The current Cyvl platform has poor usability with confusing navigation, inconsistent branding, and a complex site structure that makes it difficult for users to complete their tasks efficiently.
Objectives
Create an intuitive, streamlined user experience with simplified navigation
Implement a modern design that aligns with brand identity
Develop new features based on user personas to better support infrastructure maintenance workflows
Old Platform
How will I further approach it? Building Approach and Strategy

Discovery/User Personas
To start, I conducted user research with the following key personas. These personas represent the diverse perspectives and needs of stakeholders involved in transportation infrastructure management.

How will I further approach it? Building Approach and Strategy
Discovery/User Personas
To start, I conducted user research with the following key personas. These personas represent the diverse perspectives and needs of stakeholders involved in transportation infrastructure management.
User Studies
To gather comprehensive insights, I would conduct the following research activities
User Studies
To gather comprehensive insights, I would conduct the following research activities
The main problems I'm trying to solve are
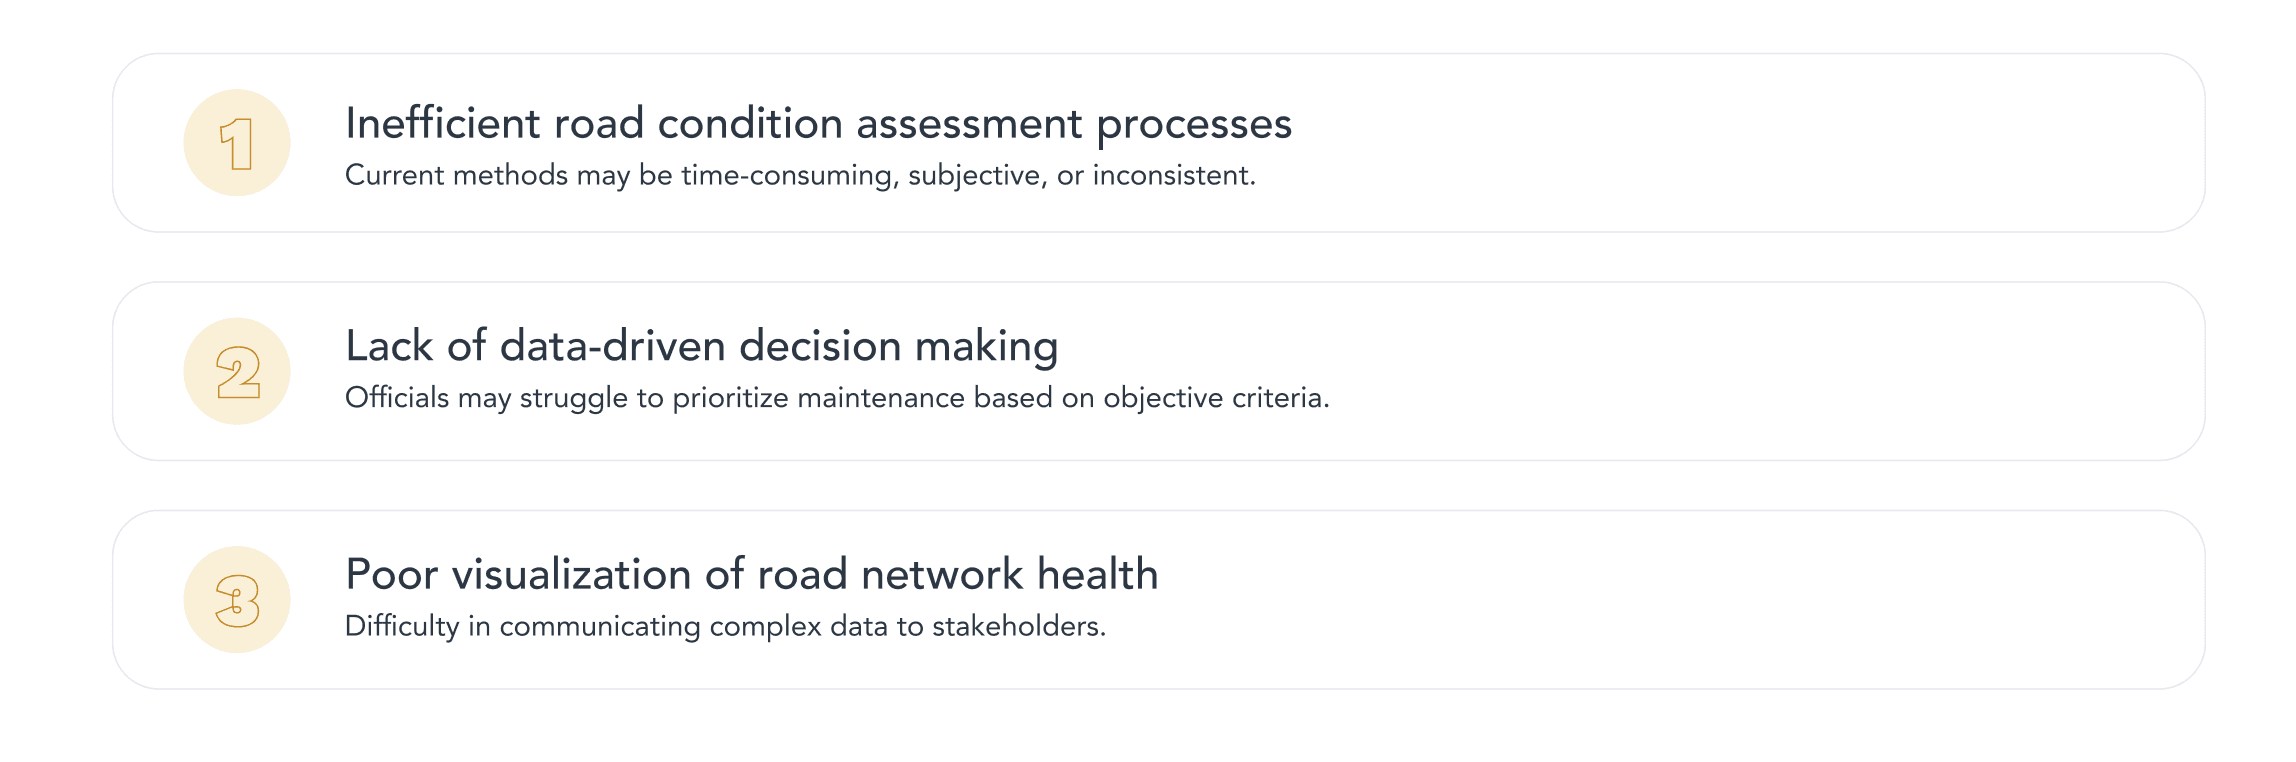
The main problems I'm trying to solve are
User flow
Now based on the research insights I’ve created a user flow that helps in smooth transitions

Rationale Behind Decisions / Research Methods
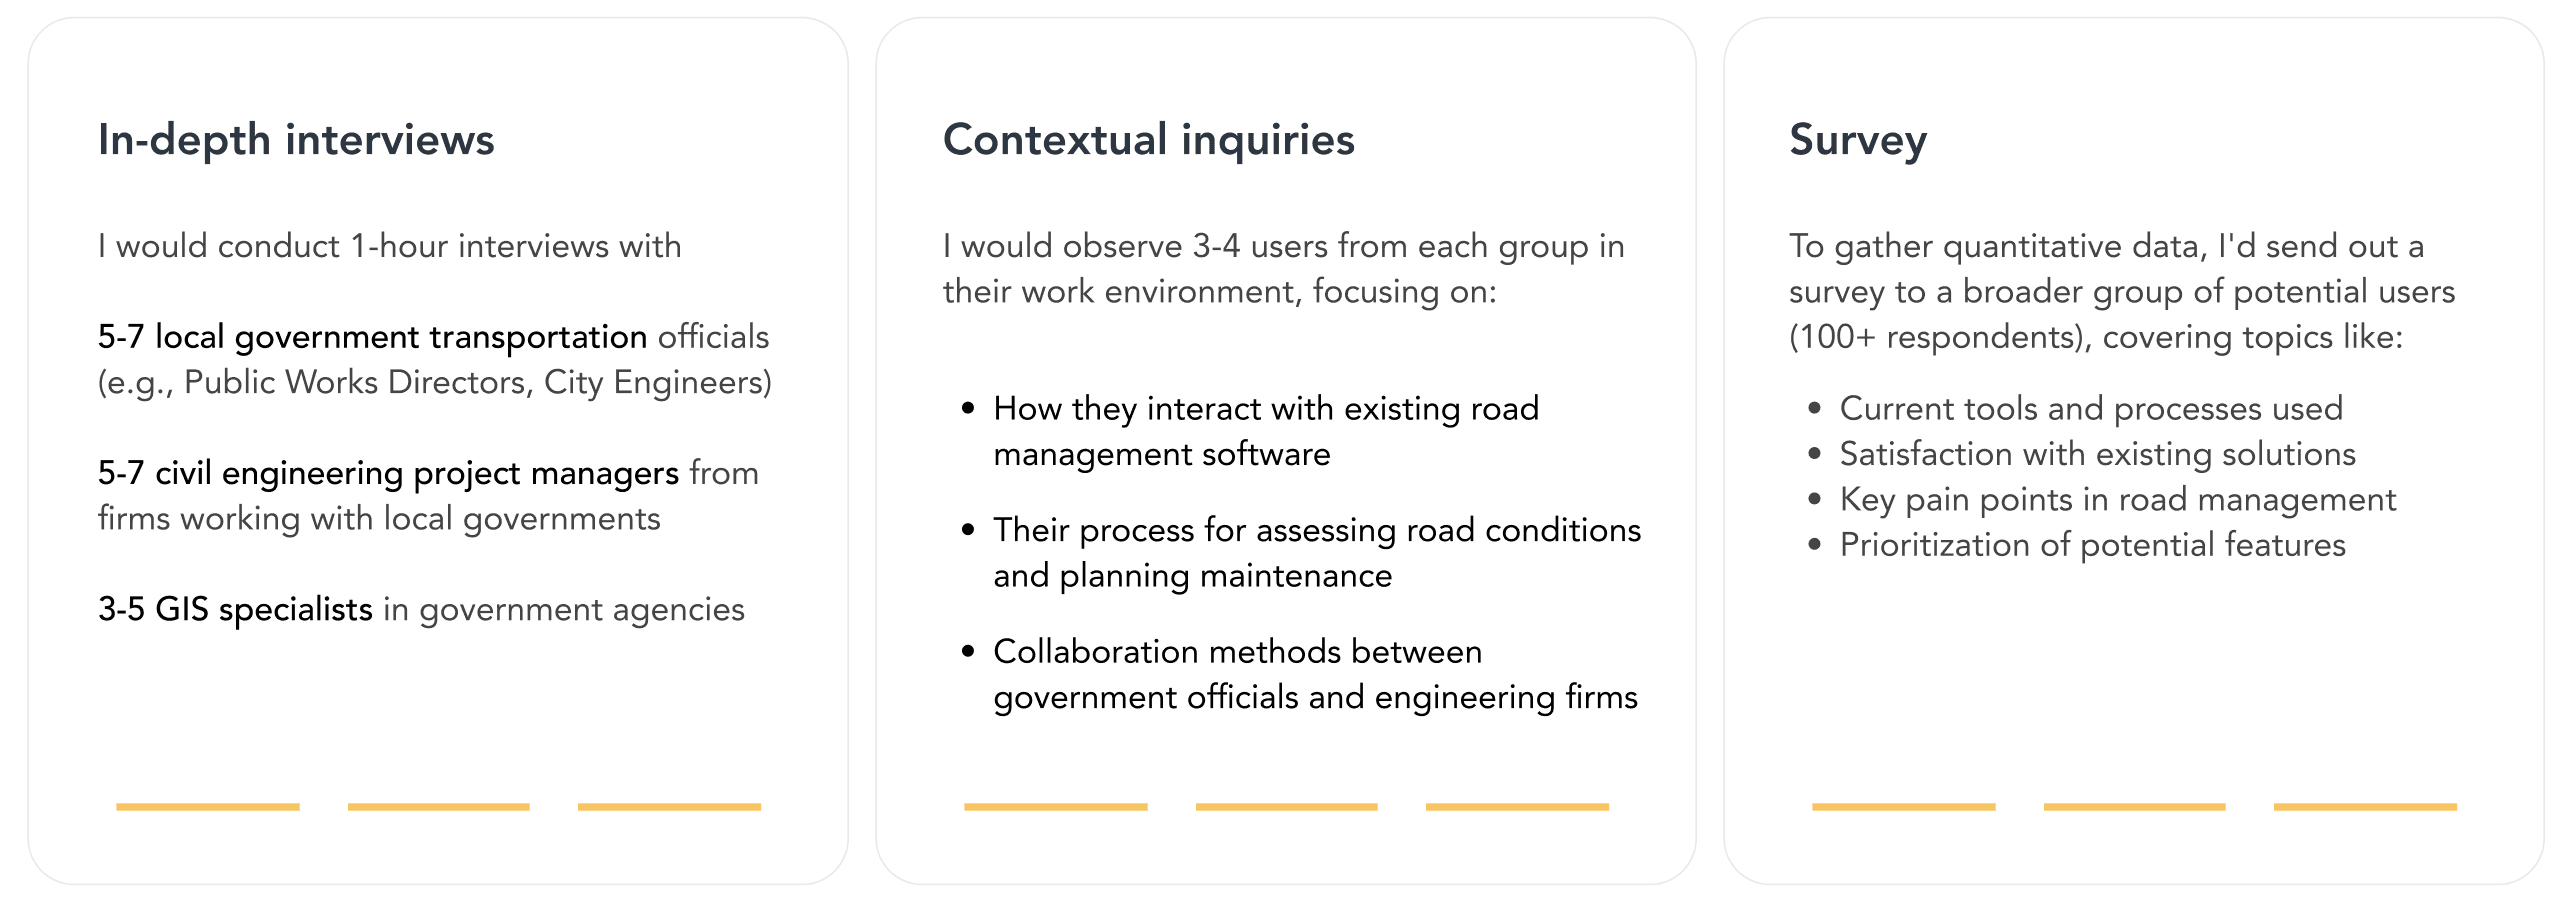
This multi-method approach balances depth (interviews and contextual inquiries) with breadth (survey), ensuring a comprehensive understanding of user needs
In-depth interviews with 5-7 participants from each user group (local government officials, civil engineering project managers, GIS specialists) allow for gathering detailed qualitative insights into their workflows, challenges, and expectations. This sample size is sufficient for identifying common themes and patterns.
Contextual inquiries, observing 3-4 users from each group in their work environment, provide valuable context on how they interact with existing tools and collaborate with others. This helps uncover pain points and opportunities for improvement.
A survey of 100+ potential users enables quantitative validation of qualitative findings and prioritization of features based on a larger sample size. This ensures the design decisions are grounded in representative data.
Rationale Behind Decisions / User Flow
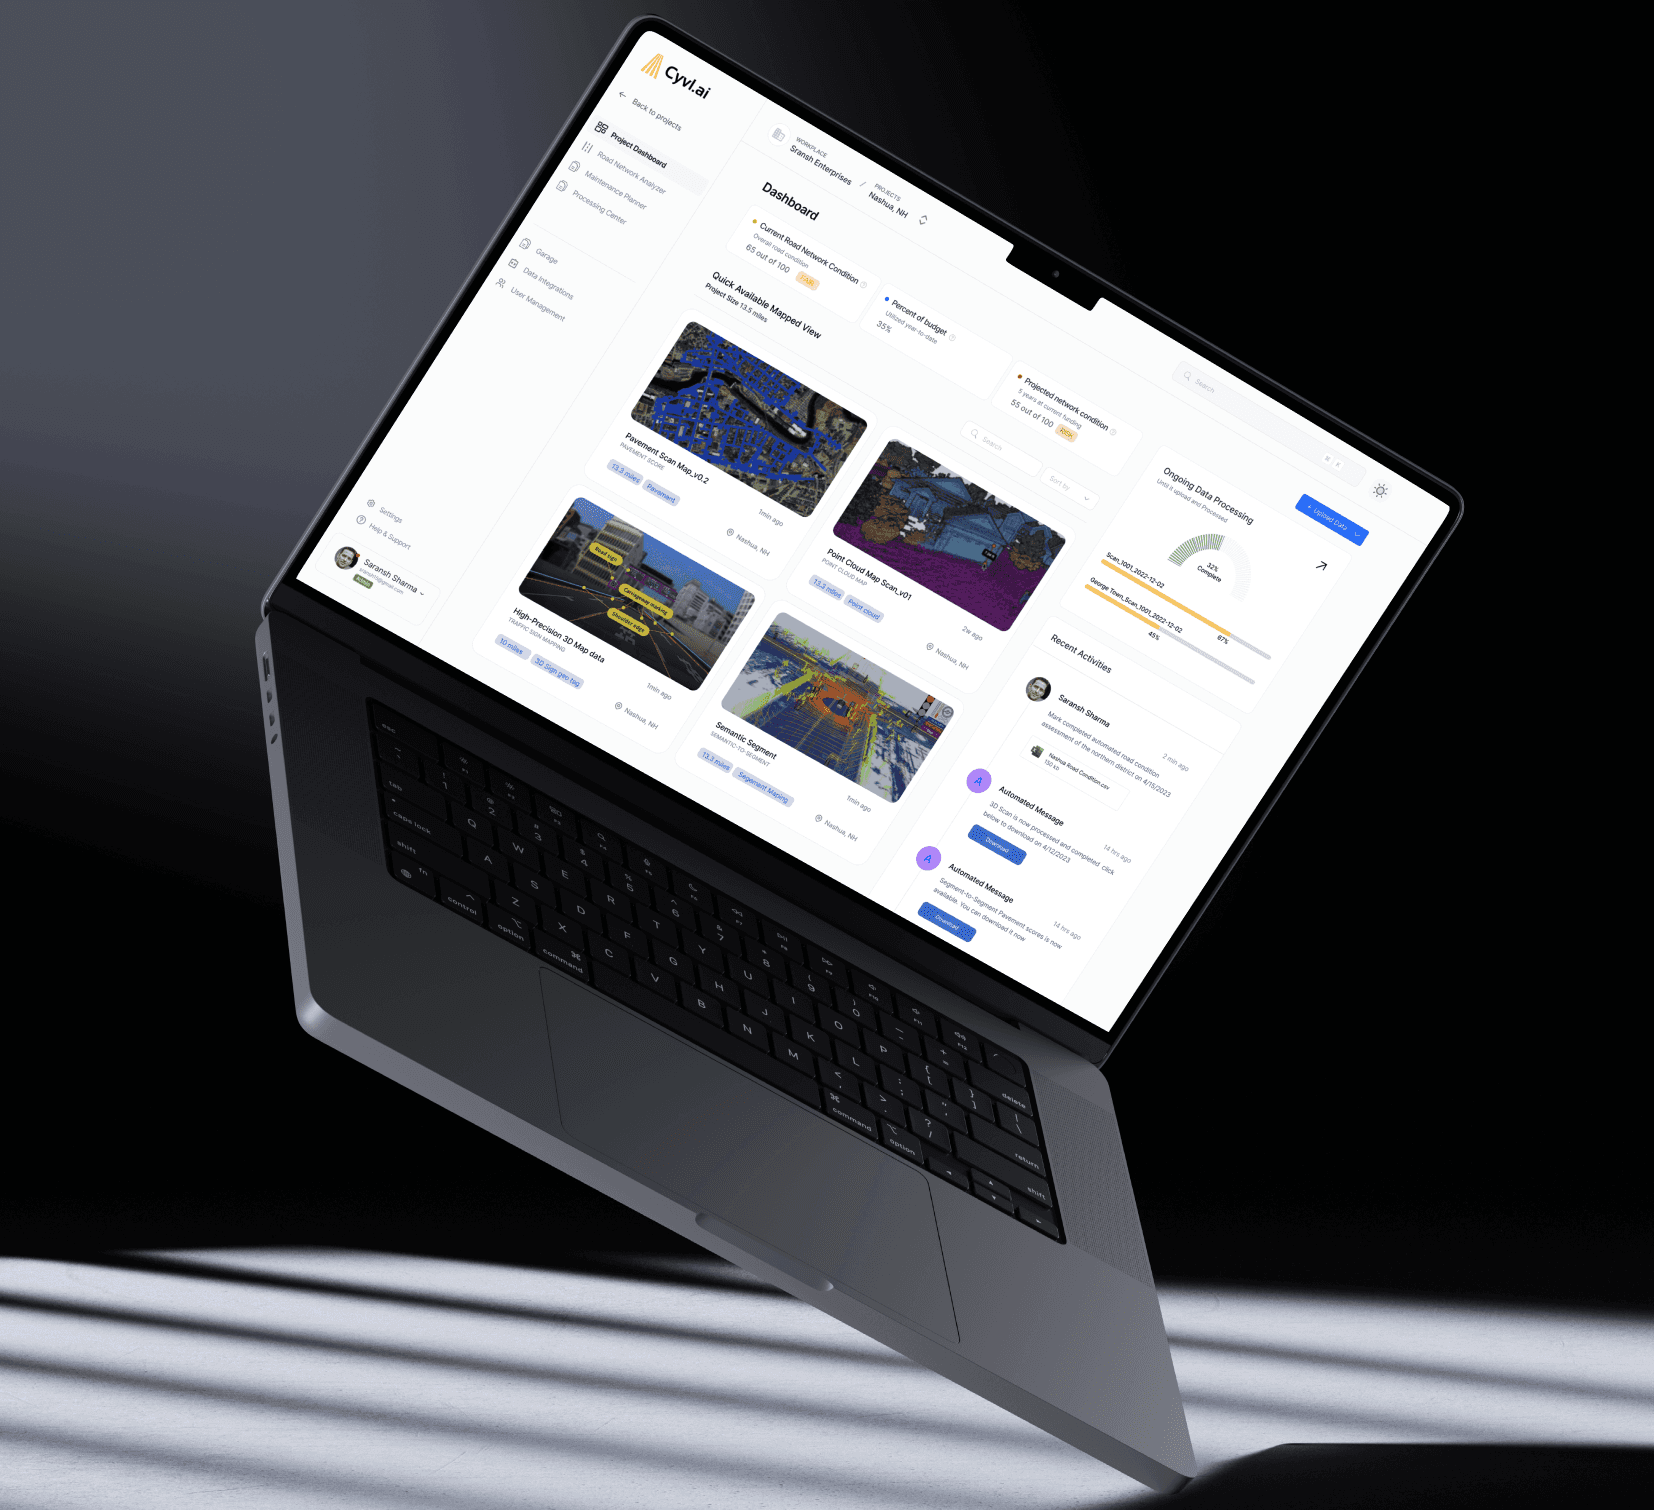
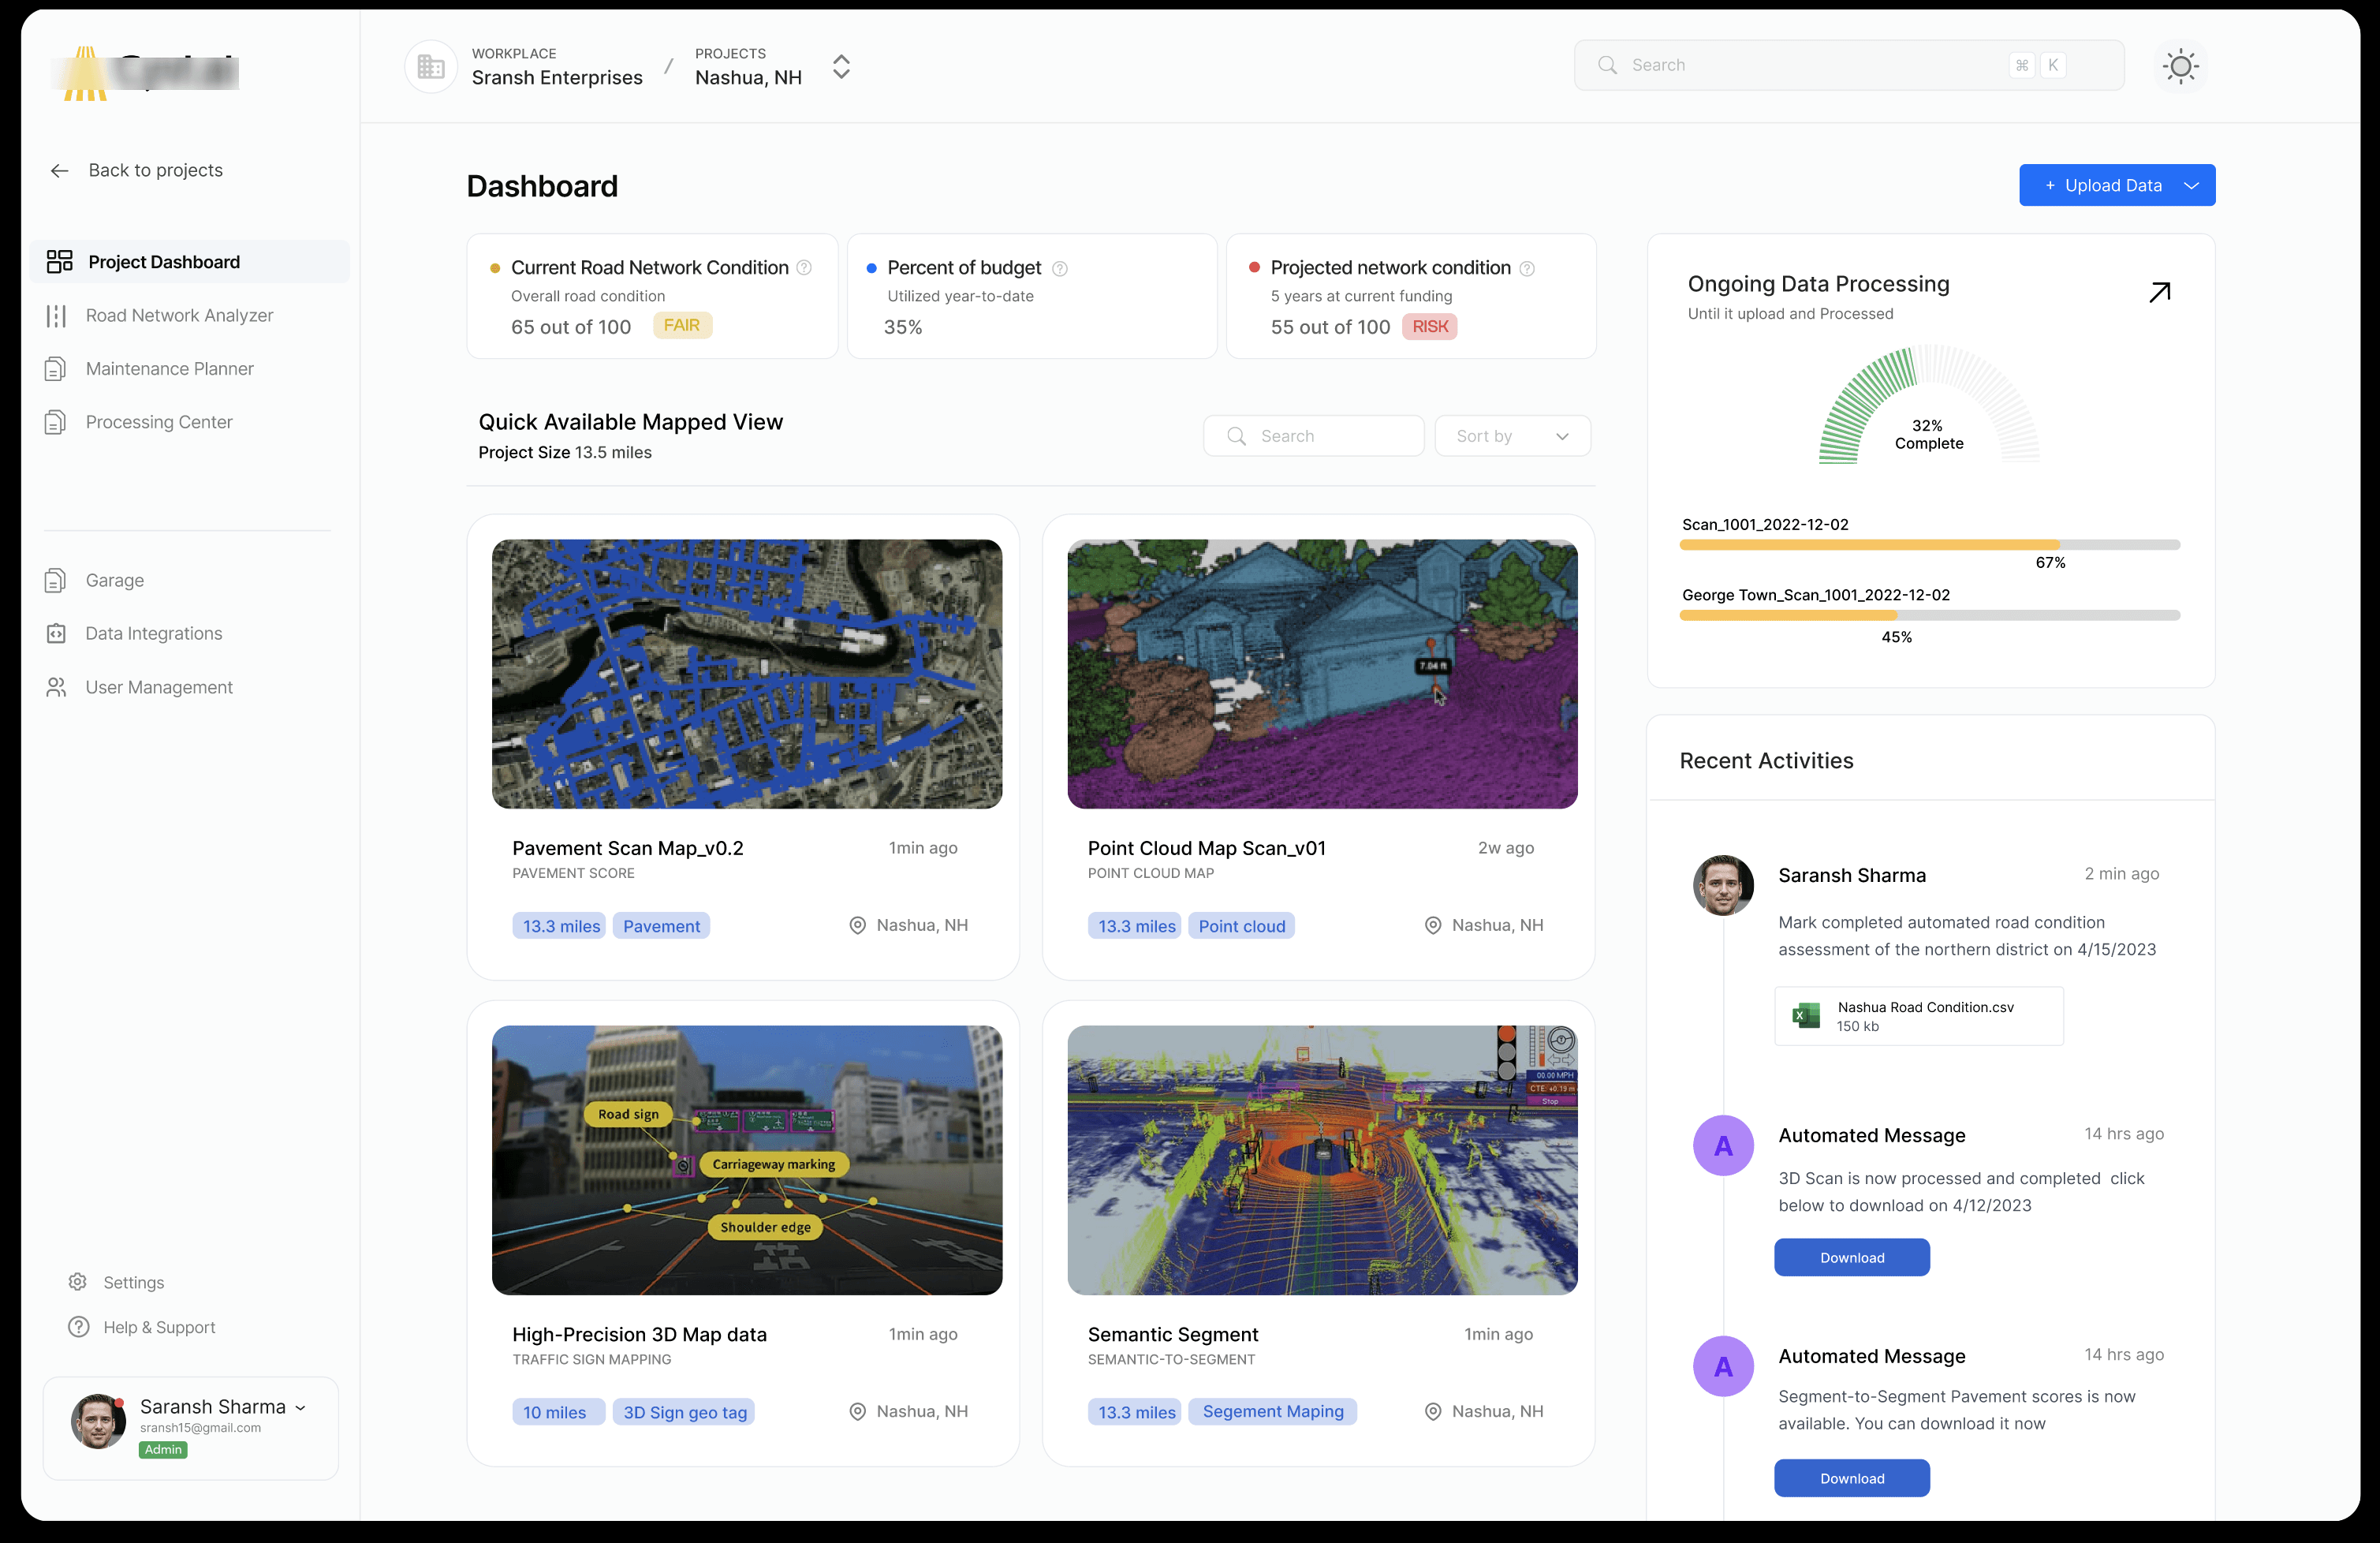
The personalized dashboard upon login provides an immediate overview of key metrics and prioritized recommendations, enabling data-driven decision making for government officials.
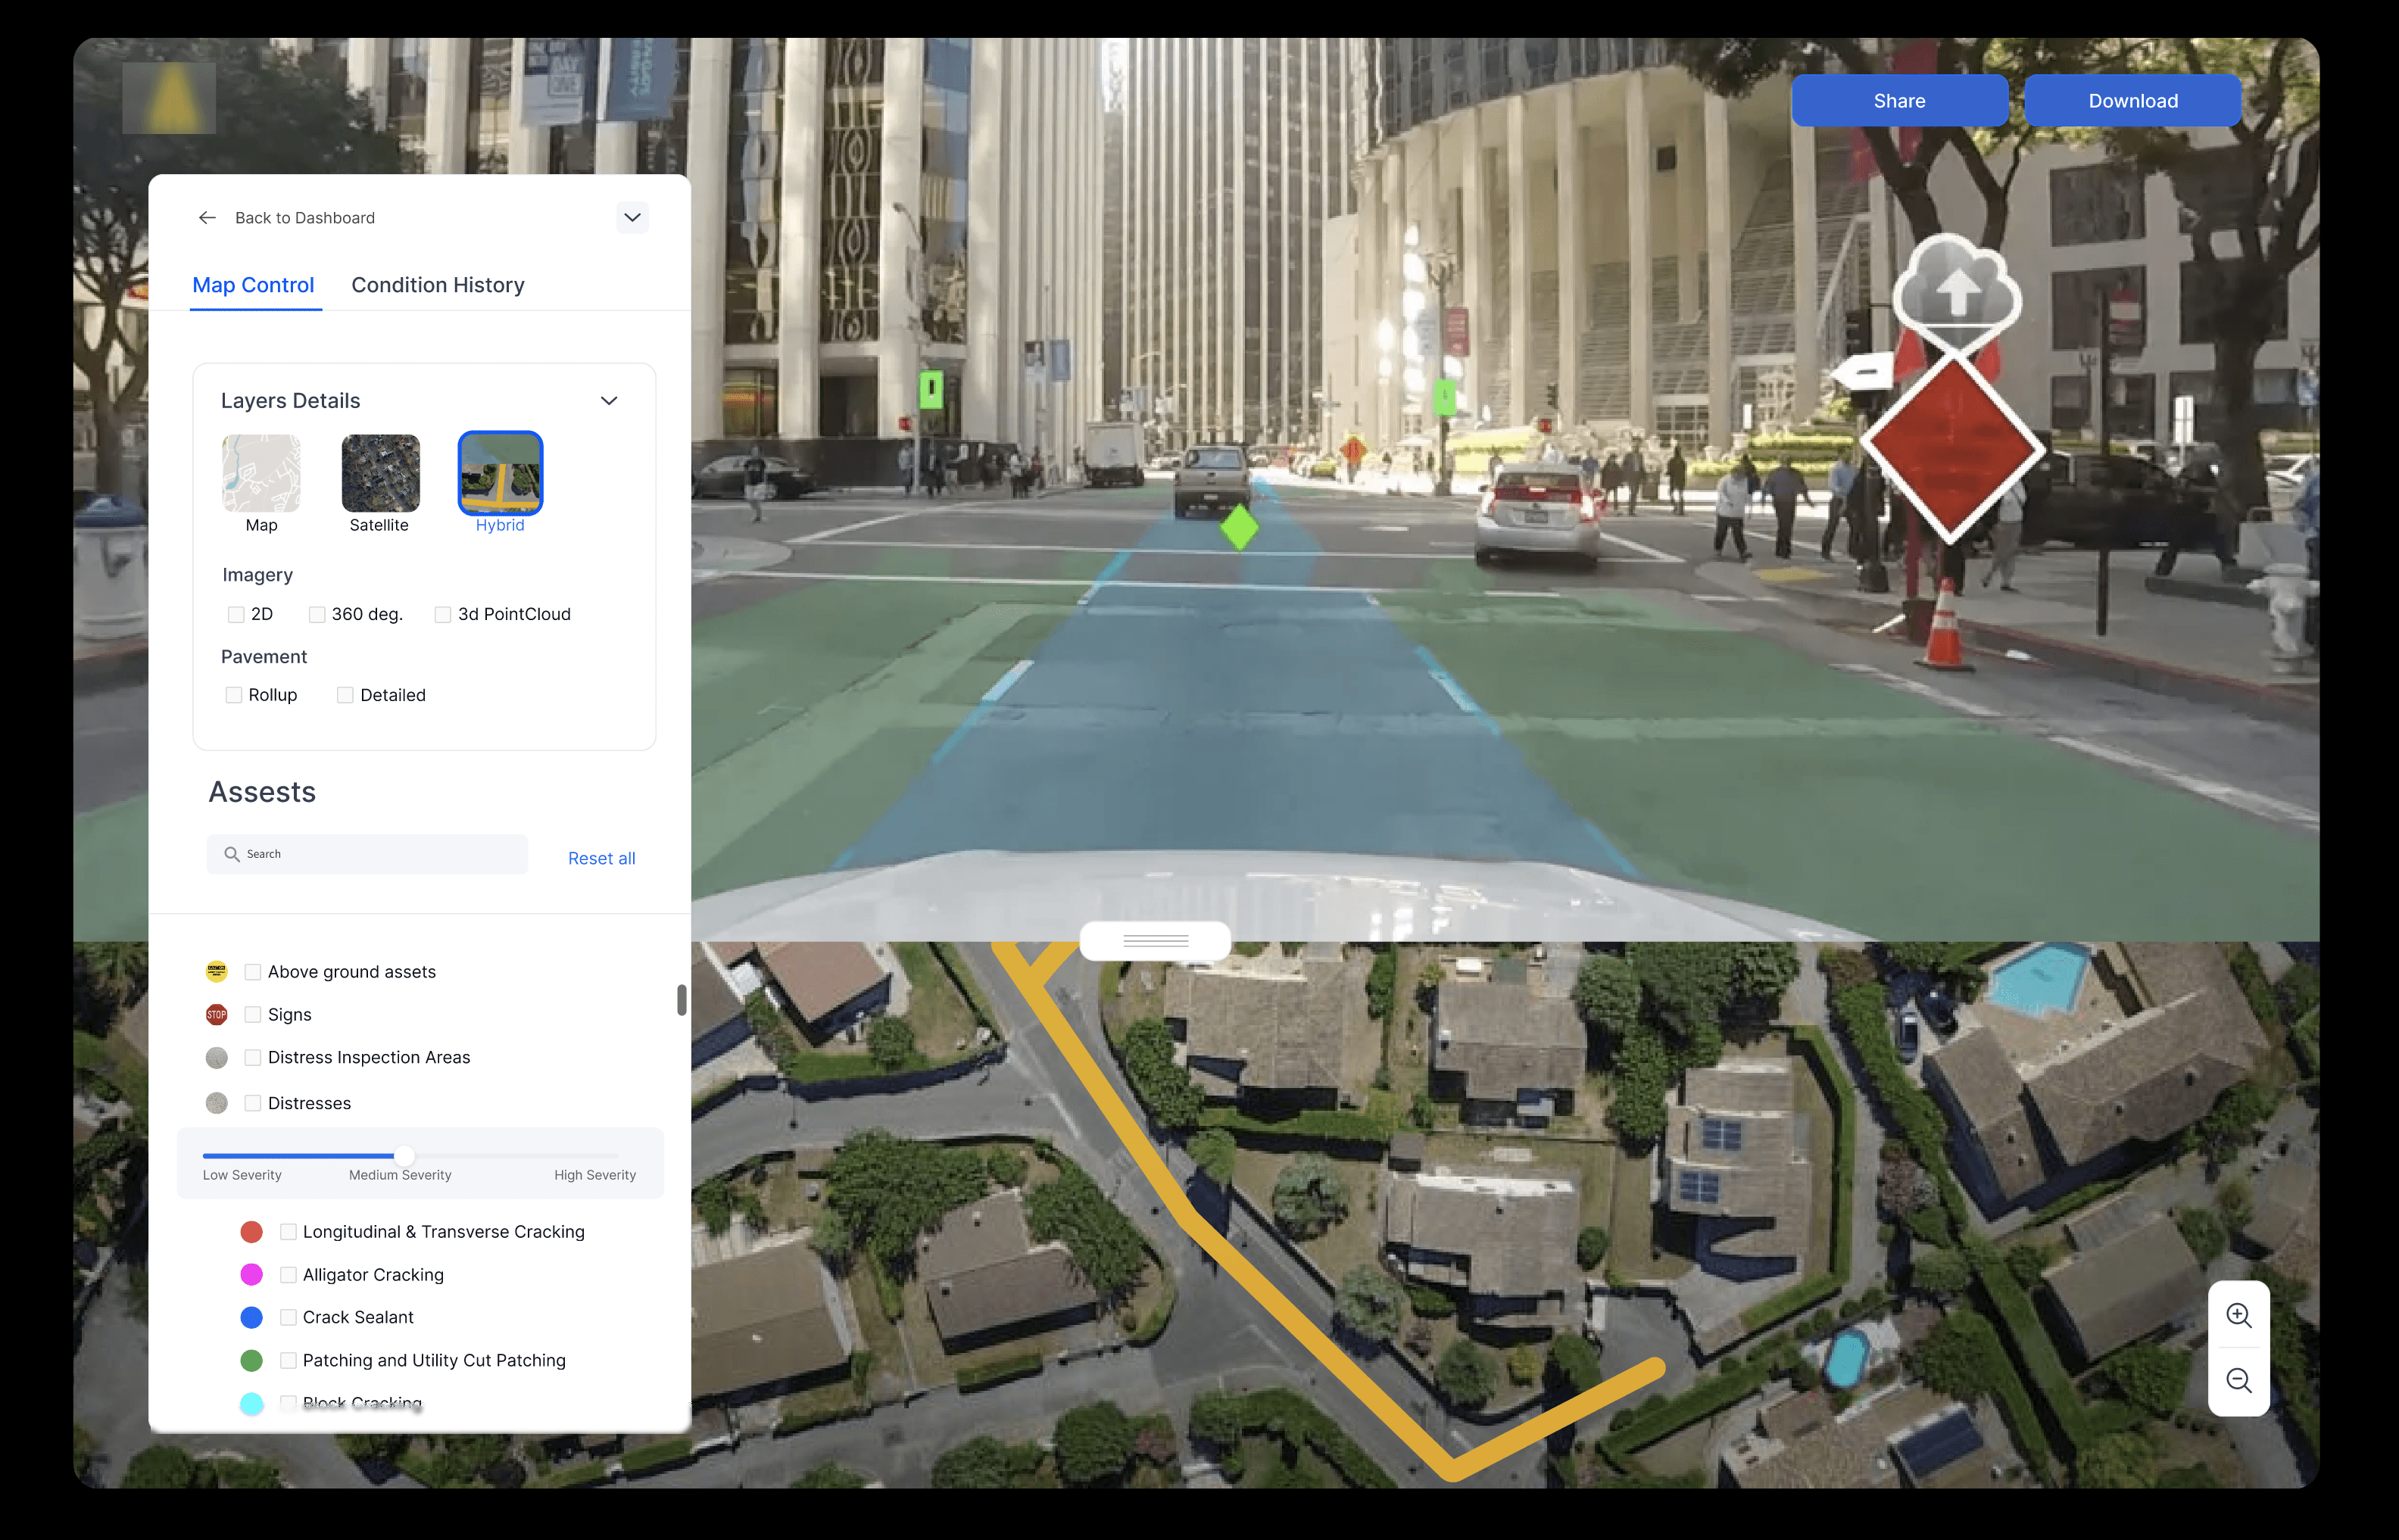
The interactive map interface allows users to visually explore road conditions, supporting better communication and collaboration between government agencies and engineering firms.
The maintenance planner with generated report recommendations and budget allocation tools streamlines the process of prioritizing projects and optimizing resources.
The settings and administration section enables customization and user management, ensuring the platform can adapt to each organization's specific needs and structure.
User flow
Now based on the research insights I’ve created a user flow that helps in smooth transitions
Rationale Behind Decisions / Research Methods
This multi-method approach balances depth (interviews and contextual inquiries) with breadth (survey), ensuring a comprehensive understanding of user needs
In-depth interviews with 5-7 participants from each user group (local government officials, civil engineering project managers, GIS specialists) allow for gathering detailed qualitative insights into their workflows, challenges, and expectations. This sample size is sufficient for identifying common themes and patterns.
Contextual inquiries, observing 3-4 users from each group in their work environment, provide valuable context on how they interact with existing tools and collaborate with others. This helps uncover pain points and opportunities for improvement.
A survey of 100+ potential users enables quantitative validation of qualitative findings and prioritization of features based on a larger sample size. This ensures the design decisions are grounded in representative data.
Rationale Behind Decisions / User Flow
The personalized dashboard upon login provides an immediate overview of key metrics and prioritized recommendations, enabling data-driven decision making for government officials.
The interactive map interface allows users to visually explore road conditions, supporting better communication and collaboration between government agencies and engineering firms.
The maintenance planner with generated report recommendations and budget allocation tools streamlines the process of prioritizing projects and optimizing resources.
The settings and administration section enables customization and user management, ensuring the platform can adapt to each organization's specific needs and structure.
Predicted Impact
This was a 2-week design sprint project aimed at creating an initial design draft for stakeholder review. Based on our preliminary research and similar platform improvements, we predict:
Short-term Impact
40% reduction in navigation time
50% increase in user satisfaction
30% faster task completion
60% more efficient data collection
Note: These metrics are predictive and will need validation through user testing and post-launch analytics.
Introducing the New Look of the Cyvl.ai Platform
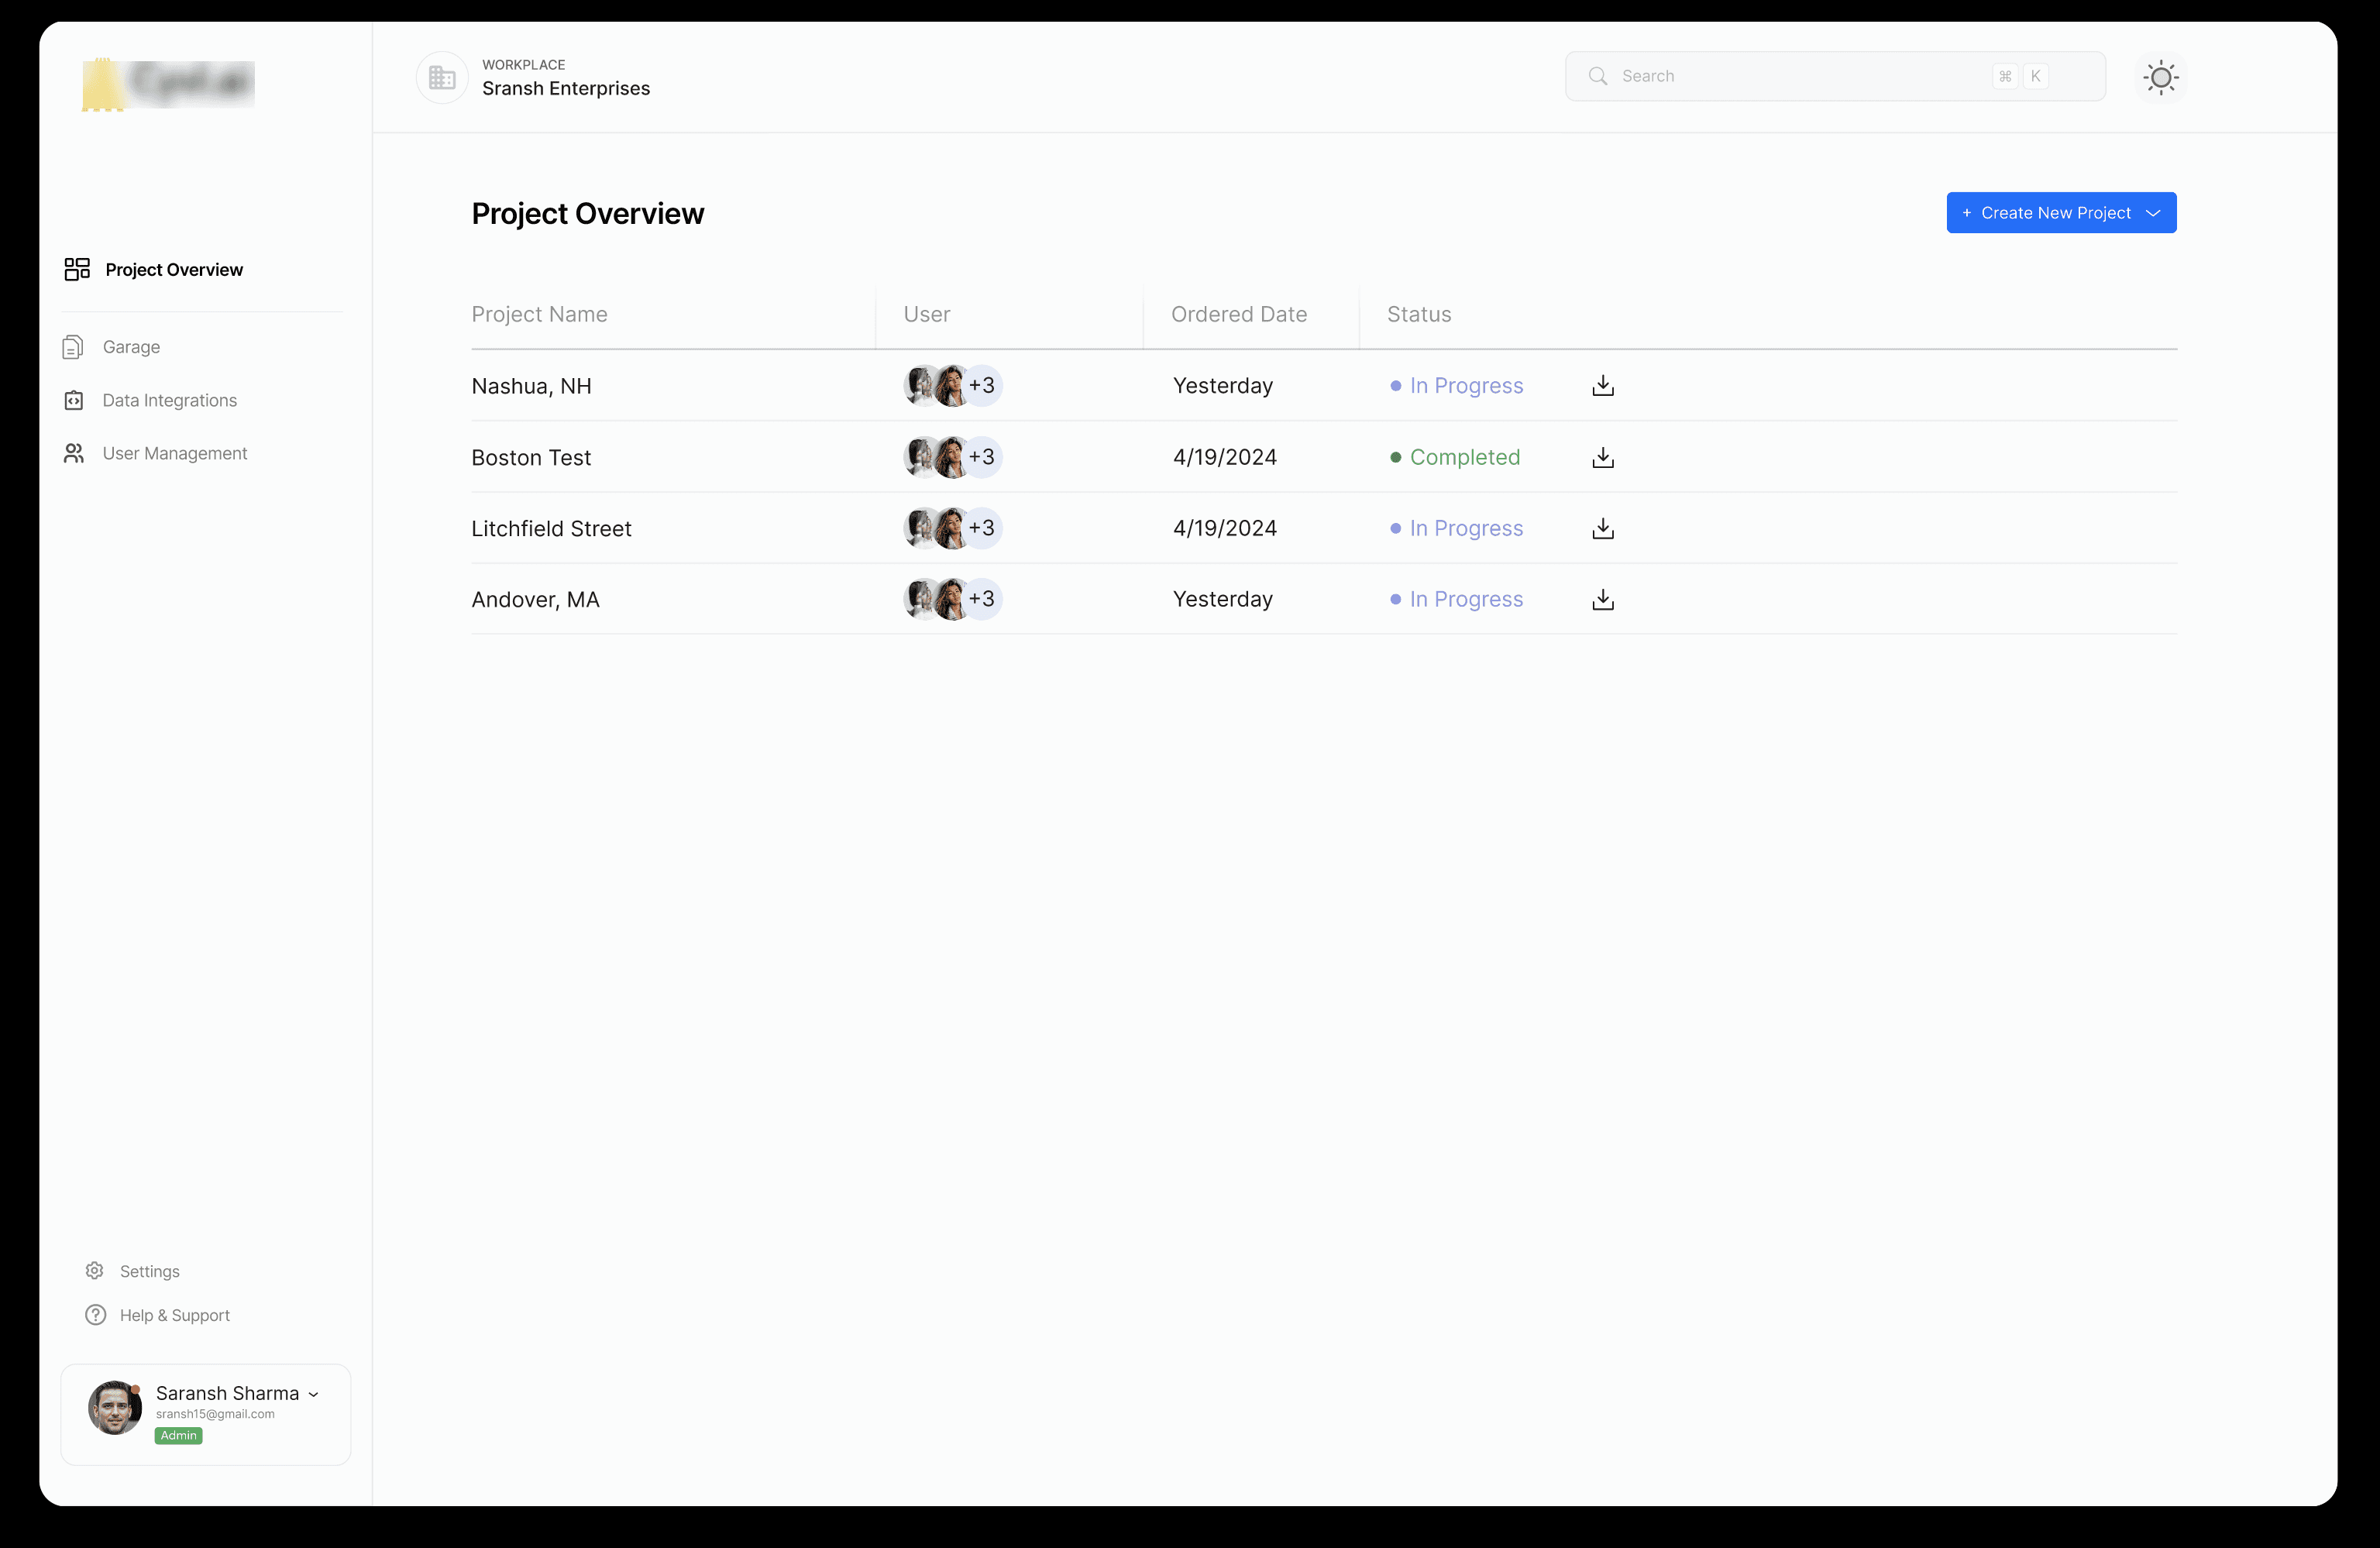
Introducing the New Look of the Cyvl.ai Platform